Reports is an amazing feature that Ninja Number provides! We are one of the only virtual phone number apps that takes your call data and turns it into useful information. You can view your call data from the last 30 days, and we break it down into many different categories to help you really zoom in on your calls. Let’s take a tour of the Ninja Number Reports feature!
First thing, and this is important, is getting to your Reports!
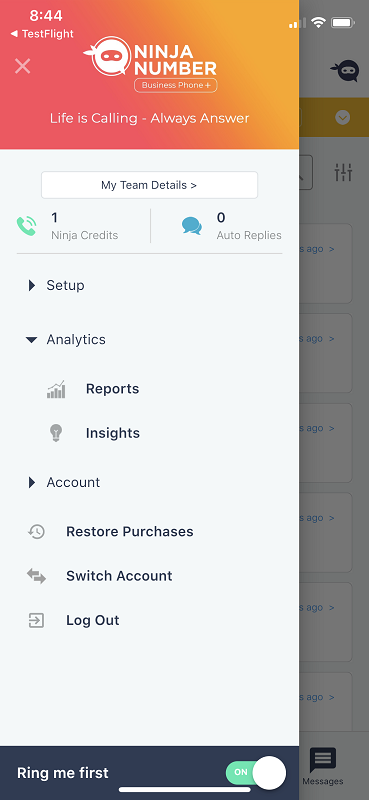
Open up the hamburger menu and select the Analytics dropdown. Tap Reports. Now you have your last 30 days of valuable call data right at your fingertips!
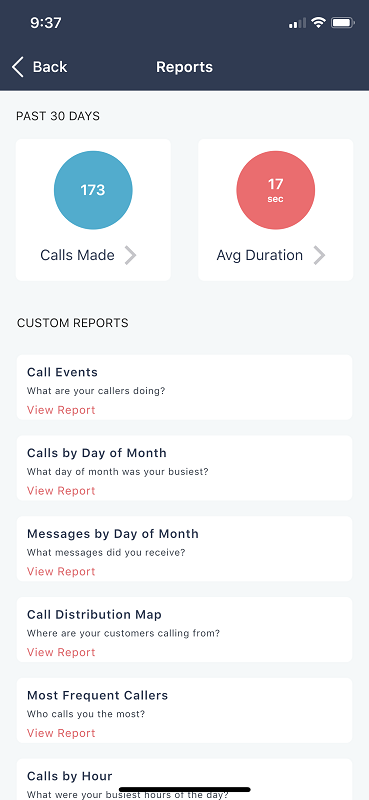
At the top of the screen, you can choose Calls Made this is your call history hub. You can see who you called, at what time and how long the call lasted.
At the top right of the screen you can see a filter icon. When you tap this icon, you can filter how you view your call history.

Back to the main Reports screen, you can also look at the Avg (Average) Duration of calls. This breaks down how long your calls typically last. You can view it in graph and table form.
But the categories don’t stop there. Going back to the main screen of your Reports, you can see your custom reports. Let’s take a look at each one:
Call Events
This category will show you what your callers are doing when they call your Ninja Number.

You can view by graph and by table. The categories are broken down by Hangup, Request Call Transfer, Call Transfer, Left Message (which is voicemail) or SMS.
A happy customer
The owner of Catch My Drift Snowplowing viewed his Call Events and saw that he was getting a lot of hang ups. He realized that a lot of people were not willing to leave a message, so he decided to sign up for Live Ninja On-Demand, so that when he and his team couldn’t answer the calls, a live Ninja Operator was standing by to take a message, providing Catch My Drift Snowplowing customers and leads the personal attention they were looking for.
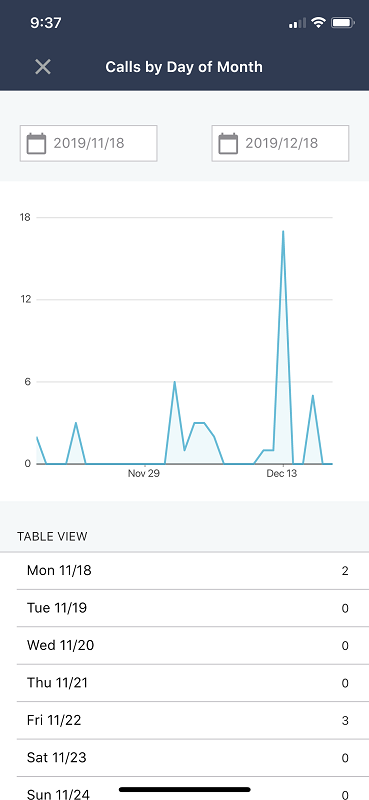
Calls by Day of Month
This category is pretty self-explanatory! It simply lays out in graph and table form the amount of calls you got during the month.
A happy customer
By viewing his Calls by Month, the owner of Catch My Drift Snowplowing saw that he got a majority of his calls on Mondays. He made sure to delegate a lot of his asks to his team so he could be available to answer the phone, which meant he had happier customer and turned a lot more leads into customers!
Messages by Day of Month
Here you can see the amount of messages (both voicemail and text) by day of the month.

A happy customer
The owner of Catch My Drift Snowplowing used this category to determine how many messages he was getting per month. He wanted to decrease the amount of voicemails he was getting, so he was able to calculate roughly how many calls were going to voicemail each month.
Call Distribution Map
This is a very handy breakdown of your calls. You can see where your callers are calling from, in both graph view and in table form.

A happy customer
The owner of Catch My Drift Snowplowing loved this breakdown of his calls for two very important reasons. He used it to zero in on his advertising campaigns because he could see where the majority of his calls were coming from. Secondly, he used to expand when he saw a trend of calls coming from nearby cities. He was able to know that he was getting customers outside of his existing base and could expand to new service areas with confidence.
Most Frequent Callers
This category is great for breaking down your frequent callers by type of call in the graph and then below in table form you can see by phone number.
Orange is Inquiry, yellow is Initial Contact, green is Qualified Lead, blue is Customer, purple is VIP and grey is Personal.

A happy customer
The owner of Catch My Drift Snowplowing like to see the breakdown of his most frequent callers in one spot. At the top of the screen he could see it by category, and below he could view the phone numbers which gave him insight into the different area codes his callers had. In one month, he could see that he was getting a lot of calls from leads in a different area code, which meant he could expand his business to serve those areas since he knew he could have customers in a new area code.
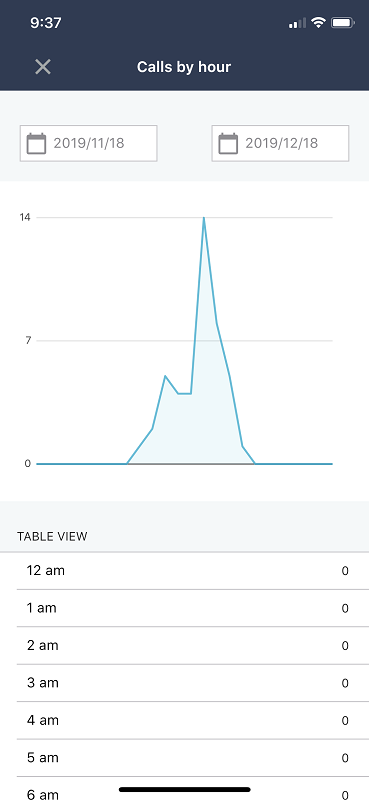
Calls by Hour
This useful report will show you your busiest call times, so you can make sure you have extra help answering your calls and responding to messages.
A happy customer
The owner of Catch My Drift Snowplowing saw that he was getting a lot of calls coming in at 5 p.m. He guessed that many callers were leaving work and wanting to get in touch with his business. He decided to create a schedule with his linked phones so they could take turns fielding after-hours calls during this time period.
Top Cities
This is a more zoomed in look at where your calls are coming from so you can quickly see the top cities from which your callers and calling!

A happy customer
Top Cities was another tool the owner of Catch My Drift Snowplowing used to determine if he could expand his service area. He could quickly see the cities that were calling the most and over time was able to scale his business outside of his original service area. What to grow!
My Caller Types
This category will show you your different caller types – Inquiry, Initial Contact, Qualified Lead, VIP and Personal.
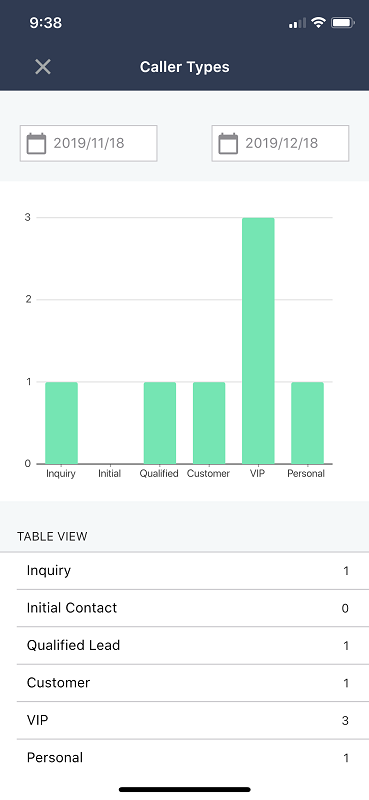
A happy customer
The owner of Catch My Drift Snowplowing could quickly view the different call types he was getting. He was glad he saved contacts and the call type, so he could easily see the volume of call types for the month. When he saw that his Qualified Lead calls were getting low, he knew it was time to vamp up his marketing and advertising efforts to get back on track!
Abandoned calls
This category will show you how many of your callers are hanging up, instead of leaving a message.
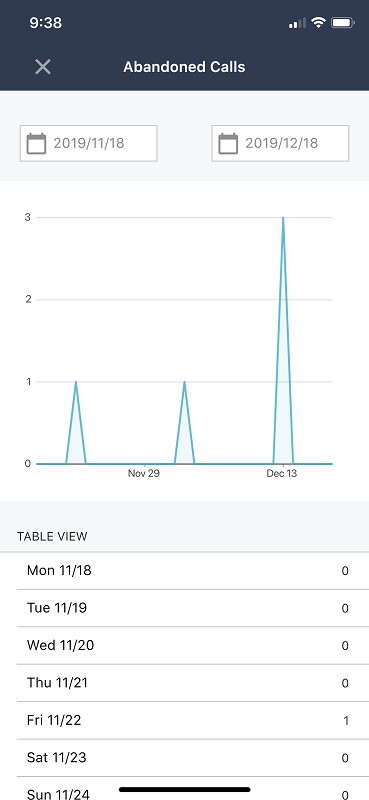
A happy customer
The owner of Catch My Drift Snowplowing knows how vital calls are to his business. He really wanted to decrease the amount of hang ups he received. After all, those could be new customers! By viewing his amount of abandoned calls per month, he set a goal of how many calls he wanted to get that down to. By using the other categories in Reports, he was able to see his number of hang ups steadily go down.