
Few things are more frustrating for mobile users than slow data speeds and bad coverage – especially when we pay some of the highest prices for mobile data. This is why we probably spend so much time looking for and switching to the best contracts possible for our mobile needs.
But where in the United States can you find the fastest mobile network speeds and the best cell phone coverage?
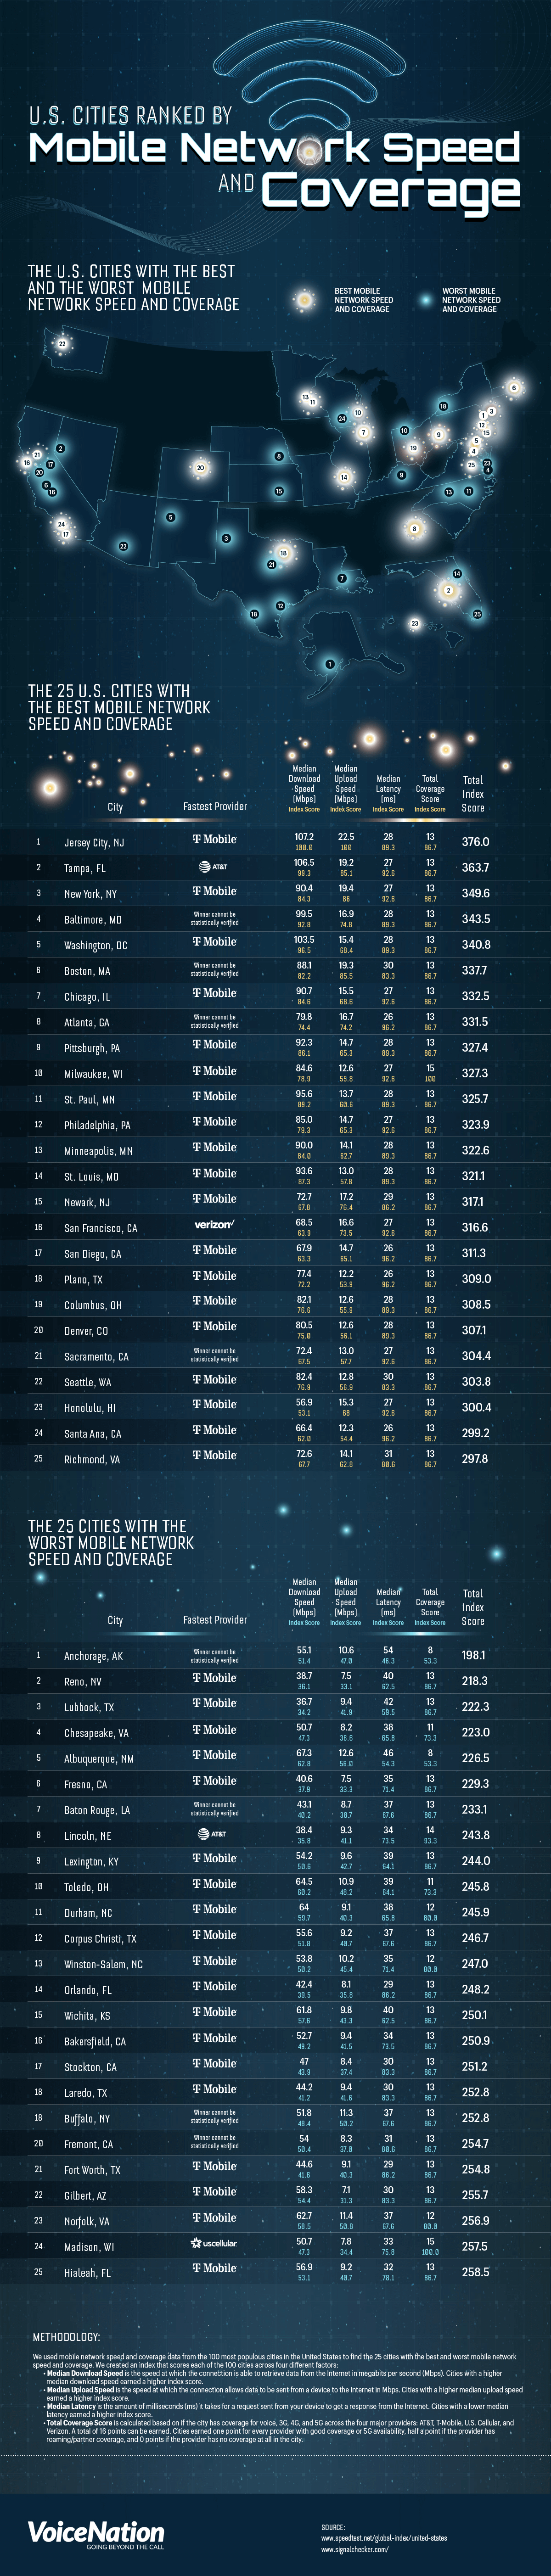
To find out, the team at VoiceNation created a mobile network index that scored the 100 most populous cities in the U.S. across four different factors in order to determine which has the best mobile internet speed and coverage overall.
With these index scores, we ranked all of the cities to find the 25 that had the best mobile network speed and cell coverage as well as the 25 cities with the worst network speed and coverage.
So, read on to learn more about which city has the best mobile network in the USA.
Which city has the best mobile network in the USA?
Based on the results of our data, it’s clear to see that Jersey City, NJ, has the fastest mobile network speed in the United States, with an average download speed of 107.2 Mbps, an average upload speed of 22.5 Mbps, and an average latency of 28 ms, giving it an overall score of 13/16.
While not full marks, this is an excellent result, and it puts Jersey City on par with most other populous cities across the country.
As for the best cell phone coverage, it turned out to actually be a draw between two cities in Wisconsin – Milwaukee and Madison. Both scored 15 out of 16 possible points.
However, while Milwaukee’s mobile network speeds were fast enough to put it at number 10 on the list of the 25 best cities, Madison’s much slower network speeds landed it on the worst cities list.
The 10 U.S. Cities with the best mobile network speed and coverage
Below are the top 10 cities for mobile network speed and coverage
- Jersey City, NJ
- Tampa, FL
- New York, NY
- Baltimore, MD
- Washington, DC
- Boston, MA
- Chicago, IL
- Atlanta, GA
- Pittsburgh, PA
- Milwaukee, WI
Which city has the worst mobile network in the USA?
Likely coming as no real surprise, the US city with the worst speed and coverage for mobile is Anchorage in Alaska. Located far to the north and away from most major cities, Anchorage has an average download speed of 55.1 Mbps, an average upload speed of 10.6 Mbps, and an average latency of 54 ms.
Sadly, Anchorage was also one of two cities with the worst cell coverage, earning just 8/16 total points. Putting it on the same level as Albuquerque, NM, which also came in fifth for the worst coverage overall.
However, while it’s understandable why a remote city like Anchorage would top the list, it’s unclear why cities in far more populous areas rank so low in terms of the mobile network speed and the amount of cell phone coverage available to its residents.
The 10 U.S. Cities With the worst mobile network speed and coverage
Below are the worst cities in the US for mobile coverage and speed:
- Anchorage, AK
- Reno, NV
- Lubbock, TX
- Chesapeake, VA
- Albuquerque, NM
- Fresno, CA
- Baton Rouge, LA
- Lincoln, NE
- Lexington, KY
- Toledo, OH
Which mobile network is the best in the US?
Now that we’ve looked at where in the US has the best and worst mobile capabilities, let’s now look at which mobile network is the best in the country. And despite AT&T being the largest mobile network in the USA, T-Mobile was found to be the fastest mobile provider in all but five of the 100 most populous cities.
Verizon and AT&T were only found to be the fastest mobile network provider in two cities each, while U.S. Cellular was the fastest provider in just one city. So, not only does T-Mobile offer the fastest speeds in most of the cities, but they were also the cell phone provider with the best cell phone coverage for voice, 3G, 4G, and 5G in almost all of the 100 cities.
There you have it, now you know where in the US has the best mobile coverage. And if the cell phone coverage where you live isn’t the greatest, then you might want to consider our live answering service or virtual receptionist to handle your calls.
Get in touch today to learn more about how we can help you, and for similar articles like this one, why not read our pieces on the best US cities for remote working, and the top cities for young entrepreneurs?
Index Methodology
We used mobile network speed and coverage data from the 100 most populous cities in the United States to find the 25 cities with the best and worst mobile network speed and coverage. We created an index that scores each of the 100 cities across four different factors:
- Median Download Speed is the speed at which the connection is able to retrieve data from the Internet in megabits per second (Mbps). Cities with a higher median download speed earned a higher index score.
- Median Upload Speed is the speed at which the connection allows data to be sent from a device to the Internet in Mbps. Cities with a higher median upload speed earned a higher index score.
- Median Latency is the amount of milliseconds (ms) it takes for a request sent from your device to get a response from the Internet. Cities with a lower median latency earned a higher index score.
- Total Coverage Score is calculated based on if the city has coverage for voice, 3G, 4G, and 5G across the four major providers: AT&T, Verizon, T-Mobile, and U.S. Cellular. A total of 16 points can be earned. Cities earned one point for every provider with good coverage or 5G availability, half a point if the provider has roaming/partner coverage, and 0 points if the provider has no coverage at all in the city.